Smartphones are helping chart an erratic region of Earth’s atmosphere that can mess with navigation systems and other tech.
That region is the ionosphere — a sea of charged particles on the edge of outer space. There, the sun’s radiation cooks gases in the air. This rips electrons off neutral atoms and molecules, creating free-roaming charged particles.
Levels of these charged particles shift with changing sunlight and solar activity. So the ionosphere over any part of the planet will look different during day and night. Earth’s weather and space weather can also make a stir in the ionosphere.
These changes can disrupt radio signals traveling through that layer of the atmosphere. For instance, they can distort GPS signals traveling between satellites and the ground. Upsets in the ionosphere can bend, deflect or absorb such radio waves. That, in turn, can cause errors in GPS navigation.
For that reason, it’s vital to keep tabs on how the ionosphere is changing in different places. A network of ground-based monitors — run by universities, research centers and other groups — does keep tabs on the ionosphere. But these stations are expensive to build and run. And existing ones can’t see the ionosphere over the whole globe. There are big gaps in coverage over Africa, South America and elsewhere.
Scientists Say: Ionosphere
Some Android phones receive signals from GPS and other satellites. These signals, captured by sensors in phones, are used for navigation. Researchers looked at a huge batch of those signals collected by smartphones. These data provided clues about how the ionosphere messed with radio signals. And they allowed the researchers to fill in poorly mapped patches of the ionosphere.
“Through crowdsourcing, we can use [phones] to change the way we understand the space environment,” said Jade Morton in a statement. She’s an engineer at the University of Colorado, Boulder, who worked on the study.
Morton and her colleagues compared ionosphere maps for two months in 2023. These maps either used data from millions of smartphones or from thousands of monitoring systems. Phone data doubled the coverage across our planet’s surface.
The researchers shared their findings last November in Nature.
The new maps even picked up features of the ionosphere that can wreak havoc on radio signals. In October 2023, maps showed bubbles of charged gas over India. The team also saw a higher density of charged particles whipped up by a solar storm. This pocket of particles hovered over North America in May 2024.
Better maps of the ionosphere could improve the location accuracy of GPS systems for cars, airplanes and more. And they might even help scientists make new discoveries about this tumultuous part of our atmosphere.
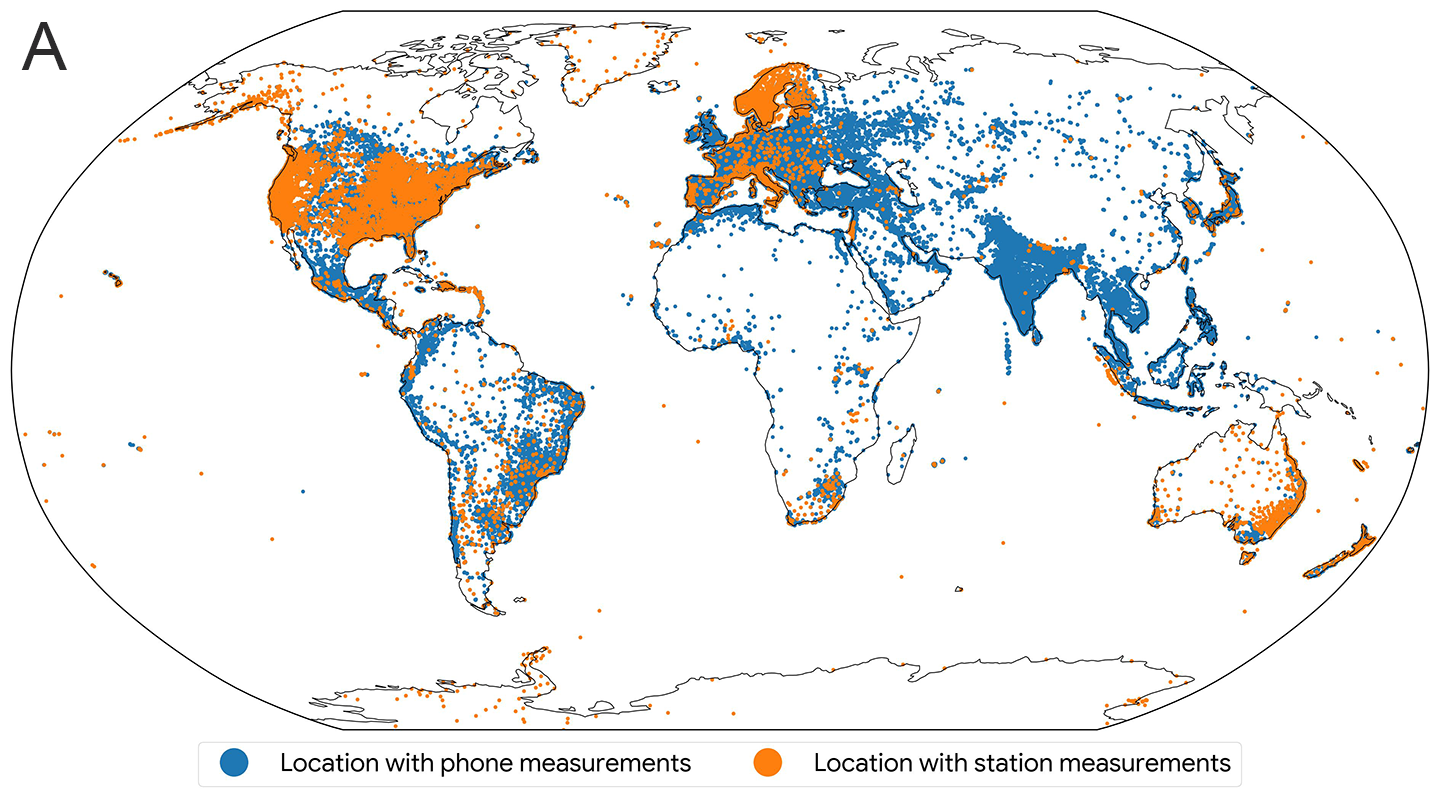
Researchers compared maps made with measurements from phones and monitoring stations. They used data from some 9,000 monitoring stations (orange dots). At around 100,000 locations, there was enough data from smartphones to map the ionosphere (blue dots).Google
Researchers made this map of the ionosphere using 10 minutes of phone data from October 12, 2023. It shows levels of ionization, or how much charge is hanging around. Ionization is measured in TEC, or total electron count, units. TEC units describe the number of electrons not attached to atoms in a square meter of the atmosphere. Higher levels of TEC units correspond to greater ionization. The map shows what’s called the equatorial anomaly. This is a band of more intense ionization around the equator that dips south over South America. Google
Data Dive:
Look at Figure A. What areas of Earth have the highest density of monitoring stations?
What areas of Earth have the lowest density of monitoring stations?
What areas of Earth have much higher coverage using phone measurements of the ionosphere than using station measurements?
Are there any areas of Earth that have better coverage from monitoring stations than from phones?
Look at Figure B. What is the range of ionization level over South America?
What regions have the highest ionization level?
Not enough data was captured at nighttime to fill in the map in some areas. Where do you think it was nighttime when researchers took their data?


